
FundersClub Partnership Returns Data: Jan 20, 2015 Update
This is an update to our previous posts and reflects our data as of 1/20/15. Previous entries are a 9/8/14 post (which reflected our data as of 7/25/14) and a 2/17/14 post (which reflected our data as of 1/25/14).
About us
Since our launch, the FundersClub Partnership has invested >$26M in 114 stellar founding teams and their companies across a variety of technology industries around the world. The capital came from our global community of over 12,000 accredited individuals and the investments were led by Alex Mittal (CEO and Co-Founder of FundersClub) and Boris Silver (President and Co-Founder of FundersClub).
Why are we analyzing and publishing our unrealized returns?
As proud as we are of the metrics above, we will be the first to say that returns matter: the quality of our product offering to investors and entrepreneurs alike is linked to the realized returns it provides.
Since launch, we've experienced realized returns for seven companies:
- Five companies, TalentBin, Lovely, Meldium, Screenhero, and one company not yet announced have been acquired at varying levels of profitability and loss
- One company has returned our capital at par and shuttered
- One of our companies has shuttered at full loss
That said, we still lack meaningful realized exit data over a long period of time. Thus, we look to other signals: many of our portfolio companies have gone on to raise follow-on funding from premier venture capital firms who then set an equity valuation. We estimate that other venture investors have deployed over $600M in FundersClub companies after FundersClub's participation.
Besides companies that have exited, we use third-party valuation events to calculate our unrealized return (see our methodology below). Of course, gauging performance of venture capital investments after two-and-a-half years is a bit like gauging the winner of a marathon after mile five: you can start to gather a sense of how things may unfold, but the journey is still very early.
We also follow the standard practice of many leading VC firms and subjectively mark down selected investments when we internally have reason to believe that the fair market value of our securities is lower. That said, as with other VC firms, the information we have about the portfolio is incomplete and imperfect, and we cannot claim to mark down all investments that, with perfect hindsight, ought to be marked down.
We analyzed our internal rate of return ("IRR"), which is a time-weighted measurement of returns (read more on IRR from Investopedia here). We used this measure to account for the limited time frame in which we are measuring our return – our average investment was funded on 12/27/13, which is just ~13 months prior to the date of this analysis (1/20/15).
We also greatly admire the work that many in the industry have done before us to bring greater transparency and data to the innovation economy. We believe that sharing data about our early results can help better inform the startup community and further the dialogue around innovation, startup capital formation, and venture capital. To our knowledge, it is unusual for an individual venture capital firm to provide this type of data publicly, and, to be fair, there is little reason for them to do so, as their LPs are typically large, private endowments and institutions.
What did we find?
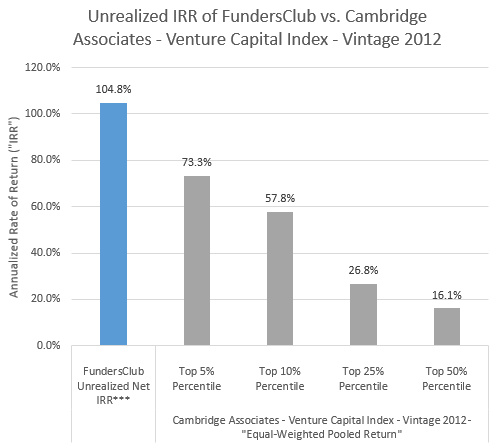
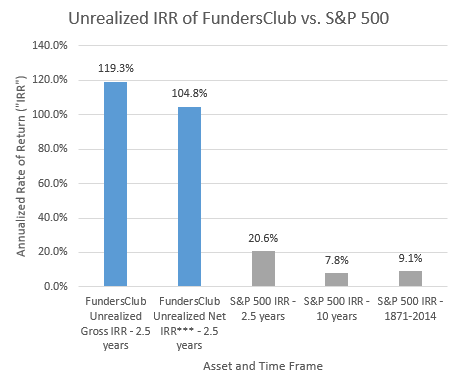
In summary, we found that a FundersClub member investing equally across all of our realized funds (5 funds as of 1/20/15) and unrealized investments (62 funds as of /20/15) from launch would have yielded, after administrative costs* and carried interest**, an unrealized annual net rate of return (also called "Unrealized Net IRR"***) on their portfolio of 104.8% after our first two-and-a-half years. We withhold administrative costs to cover the normal course expenses of private investing (items like legal, accounting, banking, registration, etc.), and our carried interest is rationalized by our sourcing efforts to find promising companies, execution of deals, and supporting portfolio companies post-investment through to successful exit or IPO. Without these administrative costs and carried interest, the portfolio would have an unrealized annual rate of return of 119.3% (also called "Unrealized Gross IRR").
While we are aiming to beat public and private benchmarks with our performance, we do not expect to be able to achieve these levels of returns over time, and given most of the investments are in the "unrealized returns" category, the actual realized returns may be significantly lower. We expect future reports of our IRR data to contain scaled down IRR numbers as markets and companies continue to rise and fall.
It should not be assumed that actual and future returns will be profitable or will equal the performance of securities in this list.
Methodology
We've had seven investments experience realizations of value (IPO, acquisition, return of capital or shuttering). For those realizations, we've marked our investments at the realized value.
- Acquisitions are marked at the consideration paid for FundersClub's shares. These marks may include consideration in escrow and/or other contingent payments.
- Shutterings are marked at the level of return of capital from the business to FundersClub, if any. If no return of capital, the shuttering is marked at $0.
For unrealized returns, we chose third-party valuation events. Based on data from the Kauffman Foundation, the average externally-backed investment exits 4.7 years after early stage funding (if it exits at all). Our average investment was funded on 12/27/13, which is ~13 months prior to the date of this analysis (1/20/15), so it is too early to tell conclusively what our return data will show. Thus, most of our valuation figures are unrealized (i.e., inherently non-concrete).
We took several steps to maintain conservative estimates of unrealized valuation.
What we DID NOT do:
- If a company received follow-on funding in the form of a non-priced round – namely, a convertible note – we did not increase the unrealized valuation of the company accordingly, even if the valuation cap of the convertible note was above the point at which we invested. For example, if we invested in Company A at a $5M cap, and then another note was issued for Company A at a $10M cap, we did not mark our investment up in carrying valuation.
- We did not use Financial Accounting Standards Board (FASB) Statement 157 fair market value reporting principles nor fair market value methodologies from Section 409(a) of the Internal Revenue Code. This type of fair market value would typically entail valuing our private investments off of public comparable companies, past transaction comparables (read: other acquisitions), and/or the discounted cash flow ("DCF") analysis, among other valuation approaches.
- Those two points together mean that, even if the company has meaningfully progressed from a business and/or operational perspective, we do not capture the potential increase in value in our analysis until the point of a third-party valuation event (typically via pricing by an institutional investor) or a realization of value.
What we DID do:
- Only counted increases in unrealized valuation when it was a third-party valuation event. That is to say, we only increased the carrying value of our unrealized investment if the company received follow-on funding priced by an institutional investor. We increased the carrying value to match the post-money valuation, less the impact of any dilutive effects, such as employee option pools, convertible notes, etc. plus the impact of any anti-dilutive effects such as an active valuation cap or discount on a convertible note. For example: If we initially purchased stock in Company A at $10M equity valuation, and then Company A receives a follow-on round at a $50M post-money valuation, our investment would be carried at 5x the valuation of our original investment less any dilutive effects plus any conversion discount or valuation cap benefits.
- Subjectively marked down selected investments when we internally had reason to believe that the fair market value of our securities is lower (though we cannot claim to mark down all investments that, with hindsight, ought to be marked down). You can read more about our markdown methodology here.
- Those two together mean we were subjectively punitive on the downside and objectively conservative on the upside.
- We also included the unrealized impact of paid-in-kind ("PIK") interest on convertible note securities, dividends on preferred equity, etc.
Even with these steps, the return outcomes for our unrealized investments are highly uncertain and may, in the end, have no bearing on the realized return profile of the FundersClub portfolio. Additionally, our past performance is not indicative of future returns, so we can't provide assurances that comparable returns (including those represented by applicable benchmark data) individually or in the aggregate will be achieved by any future FundersClub fund.
Benchmarking
As with any returns data, we believe it is important to provide comparable benchmarking to contextualize return data and differentiate our idiosyncratic returns from other opportunities.
Venture Capital Index – Cambridge Associates
Since our last blog post, Cambridge Associates, an aggregator of venture capital returns, released net return figures for 2012 vintage venture capital funds, based on data as of 9/30/14. We compare ourselves to the 2012 vintage also having launched our platform in 2012. With caveats following, the top 5% percentile of venture funds based on Cambridge Associates data for 2012 vintage funds is 73.3%.
We use "Equal-Weighted Pooled Return" because of its similarity to the FundersClub methodology of equal investment amounts across all funds.
We use the top 5% percentile as a point of comparison because of the skewed nature of venture capital returns, both for individual companies as well as the funds, and, thereby, the firms themselves. To quote Andy Rachleff, CEO of Wealthfront and Co-Founder / former General Partner of Benchmark Capital: "The top 20 firms (out of approximately 1,000 total VC firms) [5%] generate approximately 95% of the industry's returns."
Caveats to the Cambridge Associates data are as follows:
- Vintage data is too early to be significant. By Cambridge Associates' own disclaimer "Vintage year funds formed since 2010 are too young to have produced meaningful returns. Analysis and comparison of partnership returns to benchmark statistics may be irrelevant."
- Data does not cover 100% of vintage funds. Cambridge Associates cites 45 funds in their data set of a 2012 vintage. According to other sources as many as 182 funds were raised in 2012, which would yield mean that less than 25% of all funds in the 2012 vintage are accounted for in the report. Cambridge Associates data also does include many types of funds by their methodology, such as evergreen and non-commingled funds. Further, we are under the impression that this data set may exclude some top performing funds and, thus, the top 5% percentile (and other returns percentiles) could very well understate the figure across all venture funds.
- Data is not directly comparable. This happens for 3 reasons: (1) Although the FundersClub platform was launched in 2012, as were the funds with vintage 2012, our investment total continues to grow each year, whereas a traditional fund tends to invest the lion share of their fund over the first 2-3 years and then trail off or begin raising another fund. (2) For the purposes of this analysis, FundersClub is assuming the behavior of an investor who invested equally across all funds. Although "equal-weighted pool return" is similar to this approach, it is not the same because most of our funds only invest in one company (3) The Cambridge Associates data is as of 9/30/14 whereas FundersClub data is as of 1/20/15. This effect is very small because both Cambridge Associates and FundersClub are using IRR, which is a time-weighted measure. However changes in the underlying market between these dates may drive differences in the systematic return profile.
Public Market Comparisons
Because of the heavily caveated nature of Cambridge Associates aggregated venture returns to date, we additionally compared our unrealized returns to the S&P 500 (large cap equities) and Russell 2000 (small cap equities) over various time periods (not including any brokerage or other fees).
Vs. S&P 500 (dividend reinvestment included)
- Over the same ~30 month period, the S&P 500 produced a 20.6% annual rate of return
- Over the medium term (Jan. 2005 through Jan. 2015), the annual rate of return of the S&P 500 was 7.8%
- Over the long term (1871 through Dec. 2014), the annual rate of return of the S&P 500 was 9.1%
Vs. Russell 2000 (dividend reinvestment included)
- Over the same ~30 month period, the Russell 2000 produced a 21.3% annual rate of return
- Over the medium term (Jan. 2005 through Jan. 2015), the annual rate of return of the Russell 2000 was 7.3%
- Over the long term (1987 through Jan. 2015), the annual rate of return of the Russell 2000 was 7.6%

Public Market Equivalent (PME)
Beyond charting our returns against the S&P 500 and Russell 2000, the Kauffman Foundation's 2012 report "We Have Met the Enemy... and He is Us" calls out the importance of measuring venture capital performance against public market benchmarks in a mechanism called a "Public Market Equivalent" (PME). Within PME the net returns of a fund are divided by the prevailing public market benchmark. So if VC Fund A had returned, net of fees and carry, 2.0x and the public market had returned 1.5x over the same time period, then Fund A's PME would be 2.0x / 1.5x = 1.3x.
For FundersClub's unrealized net IRR***:
- Over our first ~30 months, FundersClub's PME against the S&P 500 was 5.08x
- Over our first ~30 months, FundersClub's PME against the Russell 2000 was 4.92x

Select quote from "We Have Met the Enemy… and He is Us" (Kauffman Foundation's 2012 Report): "Over twenty years in our portfolio...only twenty funds out of ninety-four exceeded a PME of 1.3."
The Power Law at Work
You can see below the individual unrealized net return multiple*** of each fund ordered from highest return to lowest return for each of the last three times we ran this analysis (1/20/15 or "30 months", 7/25/14 or "24 months", 1/25/14 or "18 months). For example, for a given line, highest returning fund, "Fund A", would be situated furthest to the left, with second highest returning fund "Fund B" as a data point to the right of Fund A. Although each line will have a different number of overall funds at the point of analysis, we compared on the same distance of x-axis. Also, some funds invest in more than one company.

So what do we see? The "Power Law" distribution is continuing to play out empirically as a relatively lower percentage of funds drive the lion share of the returns.
Even relative to our posts roughly six and 12 months ago, the power law distribution has become more extreme and better formed. Even still, we would note, as our average investment is only ~13 months old, investments currently hovering around a 0% return may jettison upward when and if they too have a third-party pricing event or realized return of capital (or conversely, turn into a complete or partial loss).
You can find the "power law" described in Peter Thiel's lecture notes (as discussed by Thiel, Paul Graham of Y Combinator, and Roelof Botha of Sequoia Capital). To over-simplify, the Power Law states that financial returns of startup companies tend to follow highly exponential, not linear, distribution, and that the differences in returns will be heavily skewed.
To quote Thiel:
"If you look at Founders Fund's 2005 fund, the best investment ended up being worth about as much as all the rest combined. And the investment in the second best company was about as valuable as number three through the rest. This same dynamic generally held true throughout the fund. This is the power law distribution in practice."
Thus, if the power law continues to hold true, we believe diversification is key, as only a handful of companies would be responsible for the bulk of the returns.
Note: Unless otherwise noted, analyses were run in the ~30 month period from FundersClub's launch on July 25, 2012 through to January 20, 2015. This data speaks only as of the date hereof, and FundersClub disclaims any obligation or undertaking to provide updates or revisions to reflect any change in its expectations or returns.
* Administrative costs: Costs reserved in each fund for banking, legal and accounting costs to curate the fund--this is not revenue for FundersClub and any remaining reserved capital is returned to members at the close of the fund
** FundersClub's carried interest on gains on invested capital--this carried interest is only applied once gains are realized, but in this case we show the "effective" carried interest if the investment exited today at the valuation calculated using the methodology above
*** Unrealized Net IRR and/or Unrealized Net Multiple reflects the realized returns (5 funds) and unrealized returns (62 funds) of an investment portfolio of equal investment across all FundersClub funds since launch. These returns are net of any administrative costs* and carried interest** charged to the investor, which may vary from the carried interest and administrative costs payable by future FundersClub funds.
Sources:
- Internal Rate of Return ("IRR") - Investopedia
- Angel investing performance - Kauffman Foundation
- Venture Capital Index - Cambridge Associates
- "Mo' money, fewer funds: 182 U.S. VC firms raised $20.6 billion in 2012, most since 2008" - TheNextWeb
- "Demystifying Venture Capital Economics, Part 1" - Andy Rachleff
- S&P Returns (Recent and Medium Term) - Bloomberg S&P 500 Total Shareholder Returns
- S&P Returns (Long term) - Money Chimp
- Russell 2000 Returns - Yahoo! Finance
- "WE HAVE MET THE ENEMY... AND HE IS US - Lessons from Twenty Years of the Kauffman Foundation's Investments in Venture Capital Funds and The Triumph of Hope over Experience" - Kauffman Foundation Report
- "The Power Law" - Peter Thiel's CS183 Lecture Notes