
Introducing My Investments™
We believe that our members need accurate visibility into their FundersClub investments in order to most effectively manage their portfolio. To date, we’ve addressed this via improvements to the way we display investor updates as well as incremental refinements to members’ investment profiles.
Today, we’re proud to announce a big step forward: a new My Investments™ experience.

Quickly access investor updates and financials from the initial My Investments™ view.
The section’s homepage brings together all information relevant to your FundersClub investments, including updates, distributions, and basic financial data.
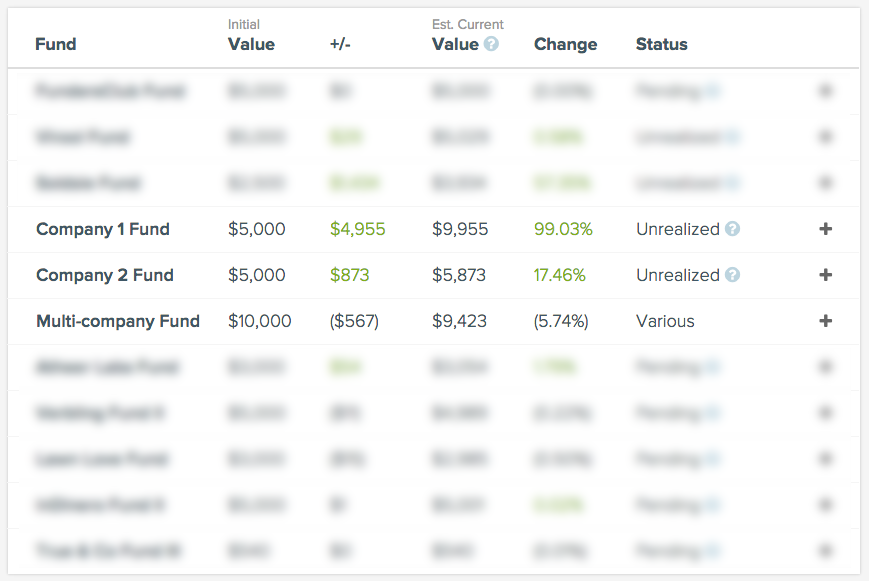
Review detailed financials and current valuations in your Investment Report.
Please note: numbers in the above image are for sample purposes only; they are not real fund performance numbers and not representative of actual returns of actual funds on the FundersClub platform.
Going further, you can now dive deeper into your portfolio with the Investment Report view. This section contains a comprehensive breakdown of your investments – valuation changes, accrued interest, and other factors which affect the value of your assets are itemized here. Your Summary Table aggregates this data, providing an easy way to review your current total return.
Finally, we’ve add a Portfolio Analysis page with several interactive charts to help you understand your current exposure and capital allocation. Diversification plays an important role in startup investing, and our Diversification Meter shows how total investments correlate with positive returns. Diversification also requires consistent apportionment – the Investment Allocation chart makes it straightforward to review your portfolio. Last, the Industry Breakdown chart organizes your investments by their industry, making it easy to identify exposures across various sectors like Retail, Education, and Ad Tech.
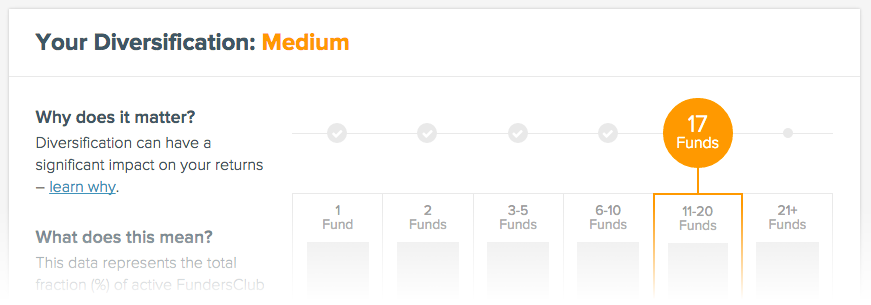
The Diversification Meter shows the relation between total investments and a positive change in estimated investment value.
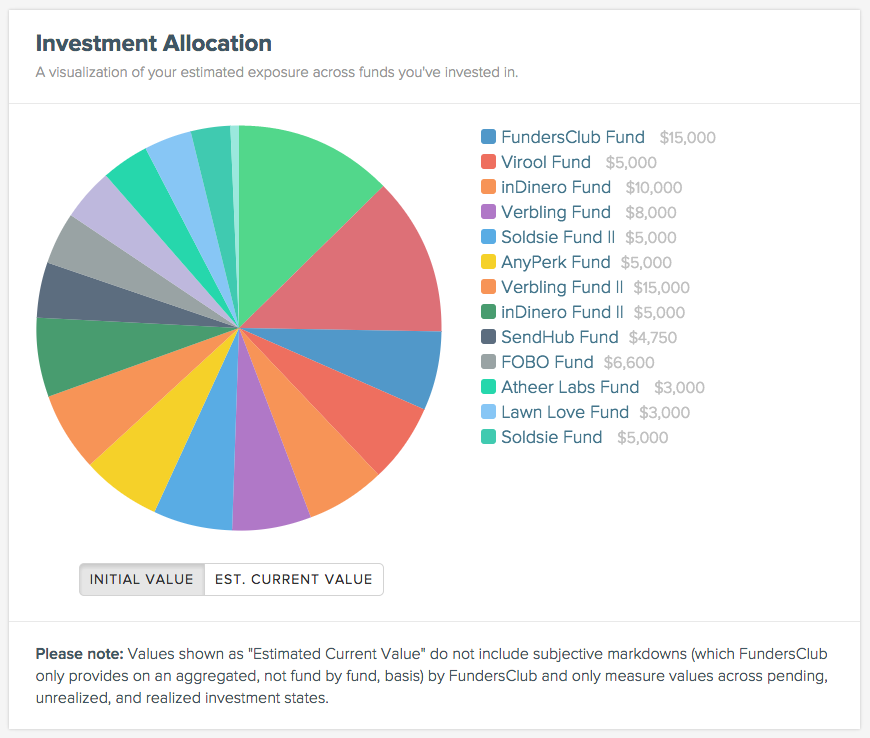
The Investment Allocation charts makes it easy to see how your capital is deployed.

Review your exposure to a given industry with the Industry Breakdown chart.
In addition to the above pages, the new My Investments™ section consolidates all of your investor updates, important documents (both tax forms and subscription agreements), and fund distributions to a single place.
You can check out the new section now and read more about it in our Help Center. We hope it’ll make managing your FundersClub portfolio easier and empower you to make more informed investment decisions moving forward.