
An Investigation Into The Relationship Between SEO And Stock Price
Editor's note: This post comes from Kevin Indig, who heads up SEO at Atlassian. Kevin's views and conclusions on this topic are his own.
Google has enormous power over companies that depend on organic traffic. One Google penalty can turn off the lights at a company that hasn’t diversified its marketing channels.
German e-commerce retailer Home24 had to wait 4.5 years until Google released it from an organic traffic break by updating the Penguin algorithm. In the meantime, the company had to spend piles of money on paid search to compensate for the traffic loss—not a tragic turn for Google, of course.
When Google tweaks its algorithms, the changes to organic traffic for some sites can be huge. For web-based companies, traffic dips generally portend a revenue dip, and that means the company, quite simply, is worth less. Google, in this way, has its foot on the valuation of not only startups, but also public companies that depend on organic traffic.
When many of Expedia’s results dropped in Google’s search results, in January 2014, its stock price sank 4%.
A connection between SEO performance and stock price makes sense logically because more and more tech companies acquire the biggest share of their users from organic search. In this way, SEO rankings can be a leading indicator of a company’s performance and its stock price.
24 public company stocks and SEO
Digging into this further, I looked at 24 public tech companies and correlations between their stock price, organic rankings and search volume.

I compared stock price and SEO Visibility (from Searchmetrics) of the last 5 years to allow for a robust set of data. The oldest company is Amazon (IPO May 1997), which went public 239 months ago. The youngest one is Twilio, which went public 9 months ago (June 2016). On average the companies are 81 months public, almost 7 years.
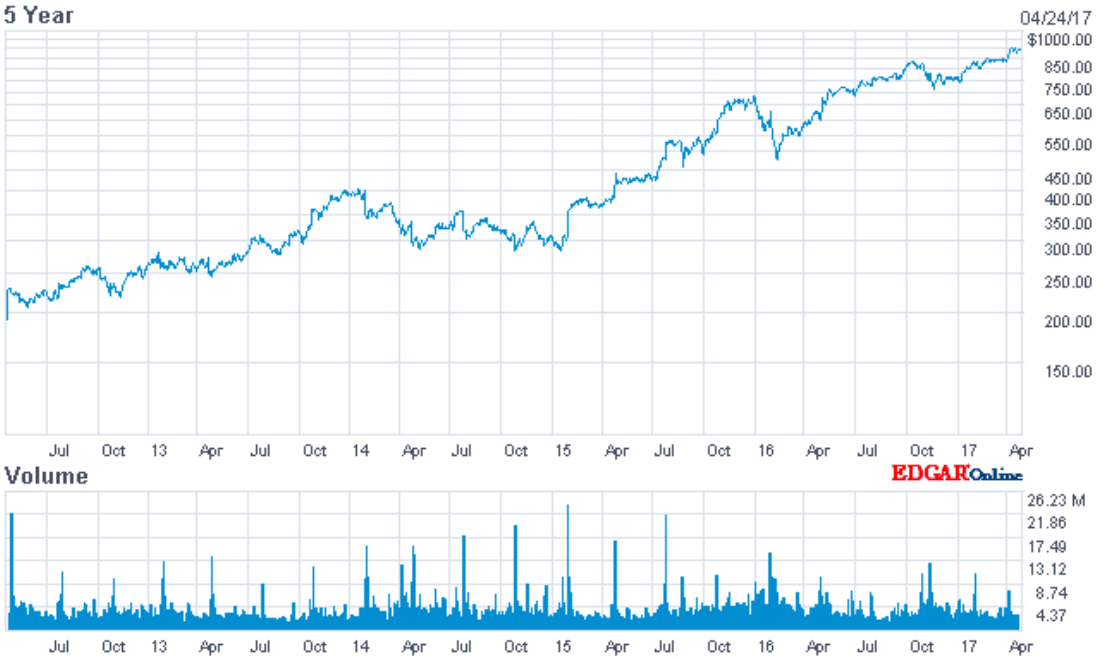 Amazon's stock price - last five years.
SEO Visibility is a measurement invented by Searchmetrics that combines search volume and rankings. It’s a performance indicator for organic search. In fact, it’s very similar to stock price itself: best looked at over time and against competitors.
It’s also helpful to look at the search volume for a brand, which allows us to quantify brand awareness or the demand for that brand. That in mind, I also compared stock price against relative search volume from Google Trends, which, to be clear, is an inexact rubric, but still an informative one.
The average market capitalization of these 24 companies is $30B. Amazon leads the pack with a market cap of ~$430B, which is more than 7x higher than that of the company in second place, Netflix (~$60B). Retailmenot has the smallest market cap with ~$550M.
Market cap does not have a direct relation to SEO Visibility. The SEO Visibility of Tripadvisor is more than 5x higher than the one of Expedia, for example. But the market capitalization of Expedia is more than 3x higher than the one of Tripadvisor.

Tripadvisor's SEO visibility has oupaced Expedia's, but Expedia remains more valuable.
To compare stock prices to SEO Visibility, which is available on a weekly basis, I simply took the weekly average of the daily closing price and matched that to the weekly SEO Visibility.
The statistical method I used is the Pearson correlation coefficient. It’s the most efficient way to check if two variables have a linear correlation and how strong it is. In our case, the value 1 means stock price and SEO visibility have a strong correlation, 0 means no correlation and -1 means a strong inverse correlation.
For example, Hubspot has a correlation of 0.71, which, in this setting, is fairly strong. Looking at the graph, and especially at the trend lines, you can see that both metrics move in the same direction.

I categorized the P coefficient for the correlations into weak (<0.3), medium (0.31-0.5) and strong (>0.5).
Hypothesis 1: Company SEO Visibility is correlative to its stock price
The analyses show that out of 24 public internet companies, 6 show a strong, 3 a medium and 3 a weak positive correlation with SEO Visibility.
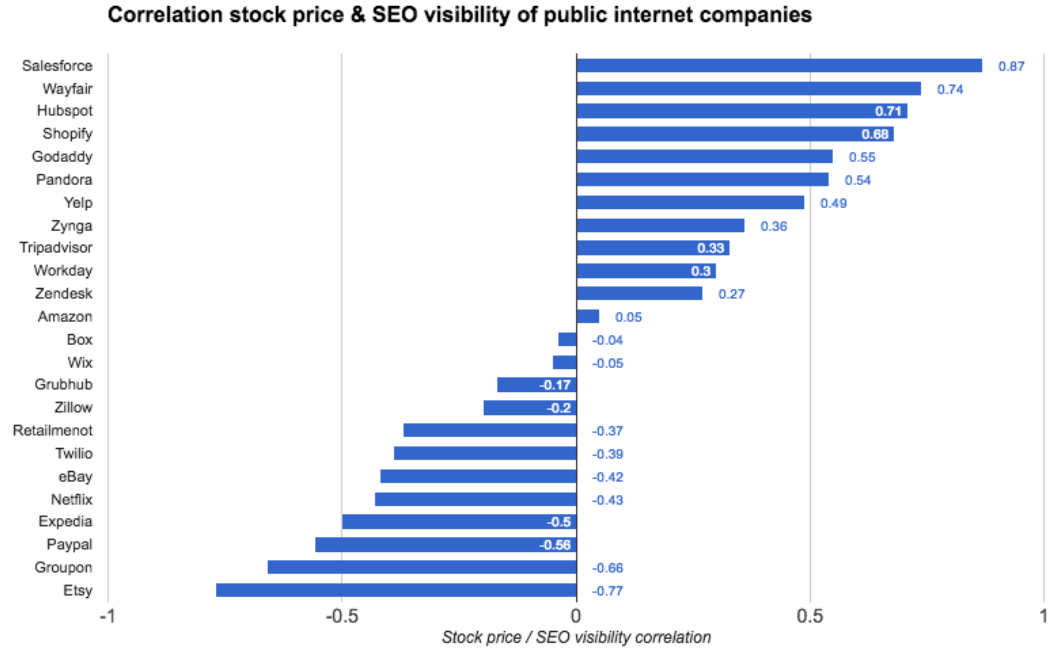
On the other side, 50% of the analyzed companies show a negative correlation, four of them weak, four medium and four strong.
So the relationships are split 50/50 between positive and negative, but there are four negative relationships with values between zero and -.2, and only one on the positive side between 0 and .2
In short, the positive correlative relationships are stronger on average, although not strong enough to draw a demonstrative conclusion.
SEO performance, of course, does impact stock price. But it’s not the only factor to have an impact, which is what makes any correlation hard to tease out. There are often multiple forces more powerful impacting an equity at any given time.
So it’s probably unwise to go buy Microsoft because you noticed Azure climbing in the rankings. It could well mean something, but it’s not enough of a signal to throw money at. A more thorough regression analysis of SEO and stock prices would squeeze noise from other factors out of the examination and yield more on this relationship.
PPC spending and stock price
When doing the research for this study, I went on a little tangent and checked if PPC advertising spending has a high correlation with stock price. When I did the analysis, two factors surfaced that seemed to make this unlikely:
1) A surprising amount of companies in the study don’t spend on PPC at all. It seems that either a company sees no value in PPC or bids only on its brand.
2) Often PPC spending is flat, instead of parallel to company value or even revenue. It seems that many companies reach a ceiling when scaling up PPC, at which they don’t see a proportional amount of revenue from the channel coming in.
Groupon has the highest correlation of PPC with stock price at 0.55, which is actually pretty strong. However, 11 of the 24 brands don’t spend on PPC and 8 show only weak (positive and negative) correlations < 0.1. Clearly, paid search isn’t very indicative of company value.
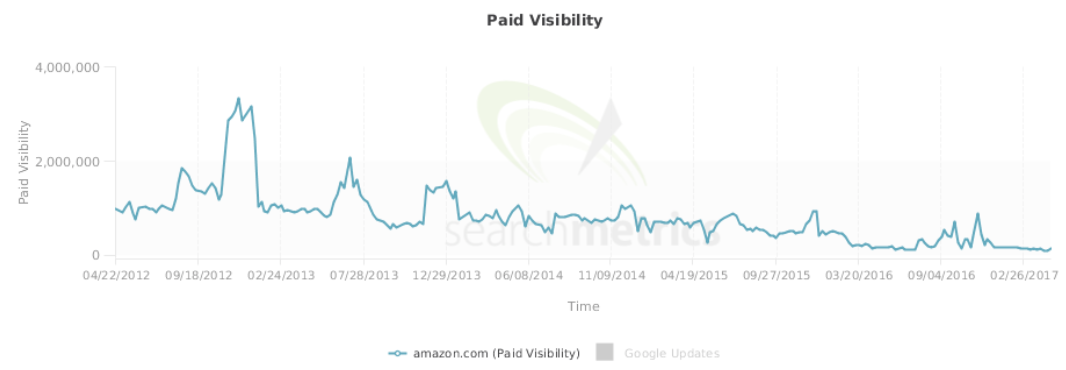
The above shows that the PPC spending of Amazon.com declined as the company’s value steadily increased.
Next, I was curious whether there would also be a relationship between stock price and a more simple Google metric: search volume.
Hypothesis 2: Search volume has a correlative relationship with stock price
In the second step, I analyzed relative search volume from Google Trends of the past 5 years for correlations with stock price.

To my surprise, the correlations were much stronger compared to the ones with SEO Visibility. Out of 24 companies, 6 show a strong, 6 a medium and 3 a weak positive correlation. Only 8 have a negative correlation, 6 of them weak. That’s an even stronger indication of a predictive character for stock price.
I assume the reason for the strong correlation is that search volume is connected to demand. News, whether good or bad, have a huge impact on search volume and stock price. It seems that because Google Trends returns the search volume relatively over time with spikes of increased search caused by events, it fits well to company value.
Conclusion
Data from SEO performance, when coupled with search volume, suggest a relationship between these two data sets and a company’s stock price. I found that nine companies have demonstrably positive correlations with SEO visibility and relative search volume, whereas only four were demonstrably negative for both factors.

The upper right quadrant above shows companies with positive correlations with organic rankings and search volume.
Only 25% of companies show a negative correlation of stock price with SEO Visibility and relative search volume. Two companies show strongly positive correlations with SEO Visibility, but negative correlations with relative search volume. Six companies correlate negatively with SEO Visibility but positively with relative search volume.
I found the strongest positive correlations for Salesforce.

Interestingly, I found the strongest negative correlation for Etsy, which is well known for its advanced approach to SEO testing.

There are surely other factors that impact the stock price, apart from organic rankings and search volume. That’s proven by some companies that have a strongly negative correlation coefficient with SEO Visibility and / or search volume.
More data will yield more comprehensive results, perhaps with more robust conclusions. Financial analysts and investors should consider SEO Visibility and search volume as metrics that should be taken into consideration for tech company evaluations, but with the caveat that they likely play minor roles in the undulations of the market.